


Strive for 25 - #1b. Defining Your Time Frame
Confluence of Uptrends

Defining Your Time Frame
In the previous post, we discussed the importance of defining your market when identifying if the market is in an uptrend. You want to identify when your market is in an uptrend to put the odds on your side that a stock will outperform the market.
In order to properly define if your market is in an uptrend you need to define your time frame.
What is Time Frame?
When trading and investing it is critical to identify how long you will hold a position before you purchase the stock.
Failing to prepare is preparing to fail - Ben Franklin.
If you do not define your time frame before entering a trade or investment, you be will susceptible to your futile human emotions.

Time frame is:
The length of time you expect to hold a position.
The window of time in which you analyze your trade or investment.
1. The length of lime you expect to hold a position
How can you identify this? Look at your past winners. How long did you hold them? Hours? Days? Weeks? Years?
No, seriously stop reading this article and go look at your past trades!
Use your past trades, and specifically past winning trades to guide the definition of your average hold time.
Just like the last article, you need to be brutally honest with yourself when defining your time frame. It’s NOT about what time frame you enjoy the most, but what time frame are you the most profitable?
Remove your emotions from the equation and look at the data. If you don’t have a history of past trades, start one!
As a matter of fact, you should keep tracking your average hold time on all your trades and continually re-asses what your most profitable hold time is.
For example, in my Stocktwits Premium Room, we’ve logged 547 trades since 1/3/2019 with an average hold time of 7.8 weeks.
You can take this a step further and see how long you held your best performing positions. In the Premium Room, we’ve held $MRNA for 57 weeks with a 376% gain, and $CRWD for 58 weeks with a 227% gain. Now, this hold time is way longer than the average of 8 weeks due to taking quick small losses like recent trades in $FND for -2% with a hold time of 1.5 weeks or even $COIN for -9% with a hold time of 4 days.
As seen from the examples above, a pure average of all your winning trades may not be the best approach to dialing in the optimal time you expect to hold a position.
For me, I’ve found the biggest winners usually have an initial rally for 9-13 weeks after “setting up” or entering post earnings drift (which we’ll cover in depth during later articles). The true market leaders will extend this intermediate term rally into a longer term rally of 6-18+ months with moves of 200-500%. These are the stocks I want to own. Hence, I look for outperformance on the intermediate time frame (9-13 weeks) in anticipation of the stock entering long term leadership.
2. The window of time in which you analyze your trade or investment.
Have you ever owned a stock that no matter the news or earnings just couldn’t seem to breakout and start moving quickly? Or maybe it moves quickly for a few days or weeks but always gets rejected near the same level?
Stocks act like this when they are not in uptrends. Especially when they are not in uptrends on multiple time frames.
Before entering a position you want multiple time frames to be in an uptrend.
Hence, I use both the daily and weekly time frame to confirm a stock is in or entering an uptrend before taking a position.
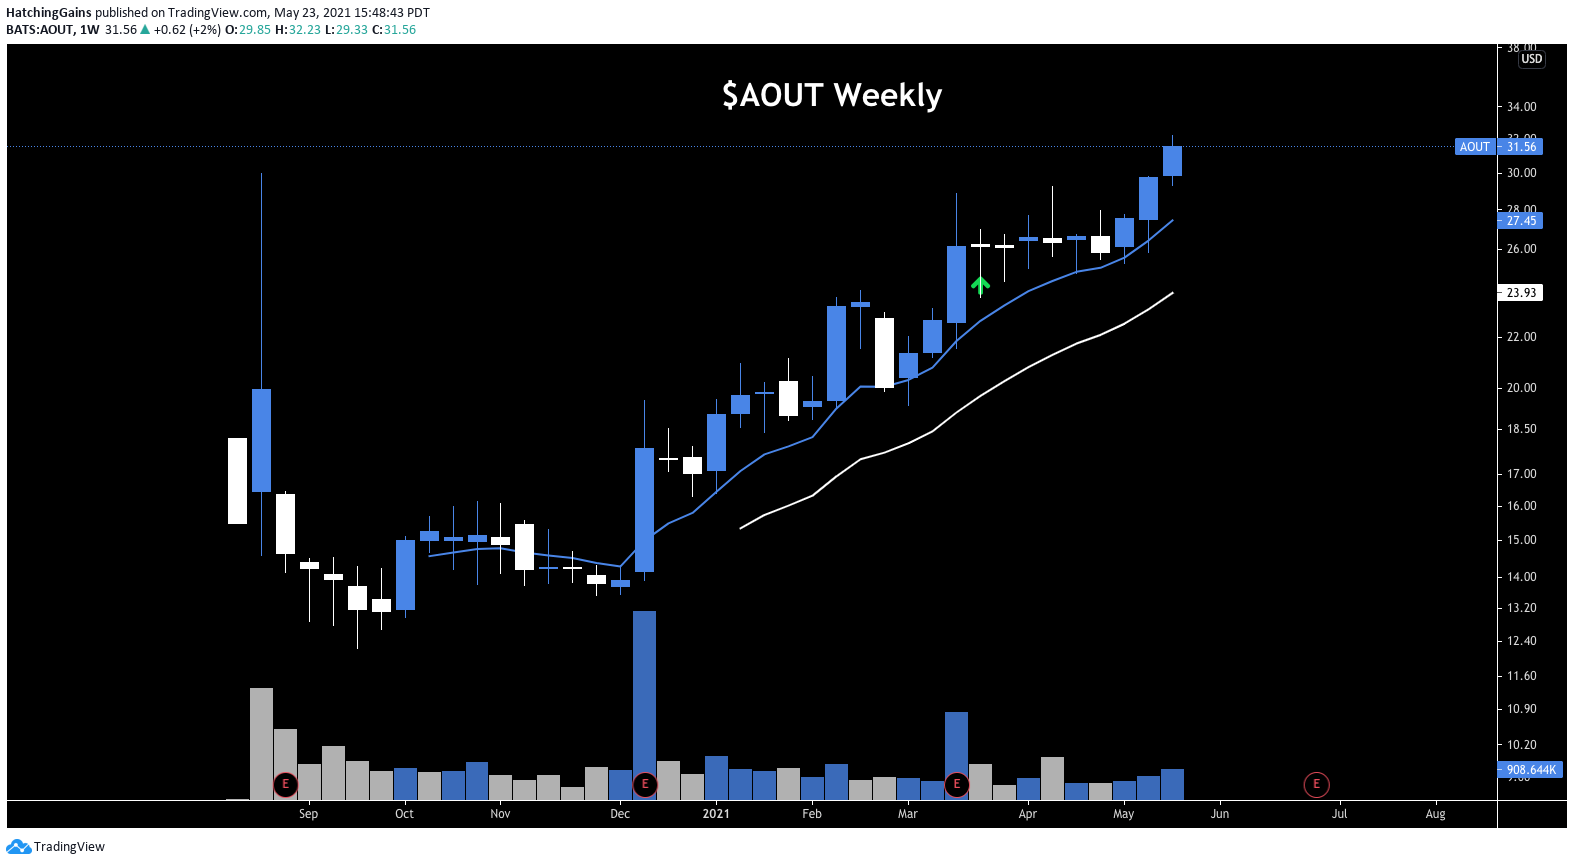
What do I mean by daily and weekly? Look at the chart below of a recent entry in $AOUT. The daily was in a stair stepping uptrend with the weekly in a clear uptrend as it emerged from an IPO base and rode the 9 EMA higher (blue line).
$AOUT on the daily time frame was stair stepping price action as previous resistance turns into support over and over again. Price was “stepping up stairs” as it rallied higher.

$AOUT on the weekly time frame was riding the 9 EMA after breaking out from an IPO base. The strongest of uptrends will become 9 EMA riders 🏍
For me, my average hold time is 8 weeks, but plenty of my big winners occur over the span of 6-18 months. That’s why I like to use a blend of the daily and weekly time frames.
It usually takes more than 8 bars on a graph to define an uptrend with proper higher highs and higher lows. Hence, my preferred time frame should not be a weekly chart as I wouldn’t get a full picture of the uptrend in enough time to pinpoint a precise entry.
Instead, I use the daily to pinpoint an entry and the weekly to validate the stock is in or entering a confirmed uptrend.
Why use both the daily and the weekly? CONFLUENCE
Confluence of Uptrends
In nature, confluence occurs when two or more flowing bodies of water join together to form a single channel.

In stocks, confluence occurs when two or more time frames are both trending in the same direction.
We want to buy stocks that are in a confluence of uptrends.
Meaning, we want to buy stocks that are in an uptrend on two or more time frames. For me, that means the stock must be in or entering an uptrend on both the daily and the weekly time frame before I enter a position.
Bringing it together
In the past 2 articles for the #1 criteria in the Strive for 25 we’ve covered how to identify an uptrend and how to identify what is your market.
Now, we have added on how to identify when your market is in an uptrend within your optimal time frame. All 3 of these are 🔑 to successful trading and investing.
To recap:
BEFORE entering a position, you want the market to be in an uptrend. An uptrend consists of a series of higher highs and higher lows.
BEFORE entering a position, define what your market is based on your past equity selection. Confirm that your market is in an uptrend.
BEFORE entering a position, make sure that your market has a confluence of uptrends on multiple time frames. Confirm that your market is in an uptrend within your time frames!
By confirming all of these 3 sub-criteria of the #1 Strive for 25 criteria, you can put the odds in your favor that you have a chance to outperform your market.
What’s the best way to have a chance to outperform your market? A leading industry. We’ll dive into leading industries during our next post when we cover #2. Leading Industry and how critical they are to identifying market beating stocks.
Stick around as it’s coming in hot to your inbox soon 🔥
In the mean time…
Join my TrendTradingBreakouts Stocktwits Premium Room.
Check out my most recent thoughts.
Leave your thoughts or questions in the comments.
Cheers to Hatching huge Gains!